Data Analysis
Two variables were compared to see how social media affected a student's daily life. Our constant variable was the amount of time students spent on their social media.
How does Social Media affect GPA?
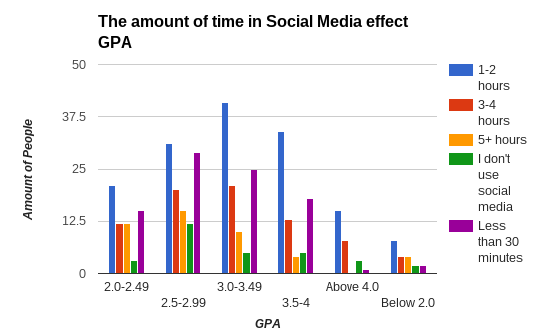
Looking at the graph, you can see how one variable affects the other. Students who spent 1-2 hours on social media tend to have a GPA of 3.0-3.49. People who spend 3 to 4 hours on social media have about the same GPA or lower. You can see how the time spent on social media affects a tudents GPA. This shows that are hypothesis on this part is correct.
Why we chose this graph: The Bar graph clearly represents the students who have a certain GPA compared to the amount of time spent on social media.
How does Social Media affect Sleep?
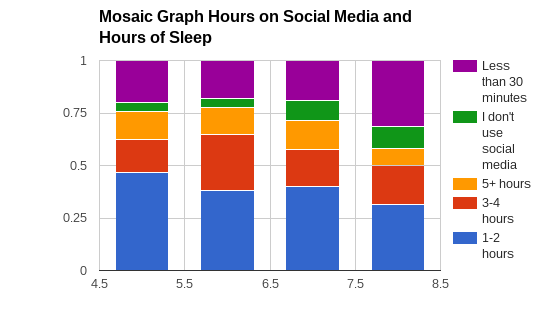
The Mosaic Plot shows the hours of sleep and hours spent on social media. Those who spent less time one social media have more hours of sleep. In addition those who spent more hours on social media have less sleep. Those who did not use social media have the greatest amount of sleep- they sleep more than everyone else. This data proves that one does somewhat affect the other. The amount spent on social media is affecting the amount of sleep a student has, but it doesn seem that it is by much.
Why we chose this graph: The Mosaic plot show a clear demonstration of the percentages when students have a specific hours of sleep and the amount of time they spend using social media all in one column.